Plotting and Summary#
Rule plot_statistics#
Plots static and interactive charts to analyze system results.
Inputs
A solved network
Outputs
- System level charts for:
Hourly production
Generator costs
Generator capacity


- Emission charts for:
Accumulated emissions

Rule plot_network_maps#
Plots static and interactive charts to analyze system results.
Inputs
A solved network
Outputs
- Capacity maps for:
Base capacity
New capacity
Optimal capacity (does not show existing unused capacity)
Optimal browfield capacity
Renewable potential capacity

- Emission charts for:
Emissions map by node

Rule plot_validation_production#
Rule plot_natural_gas#
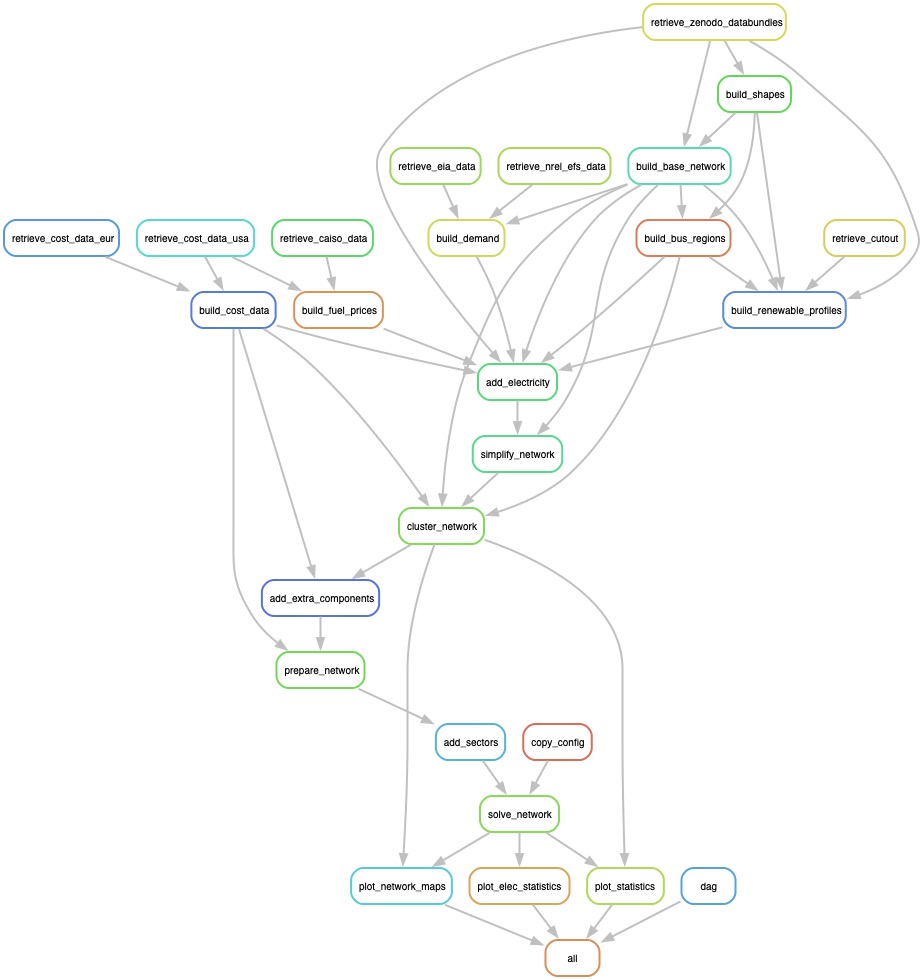
Rule dag#
Creates a Directed Acyclic Graph of the workflow
Outputs